Pembury History

Misleading Maps and Misreading Maps


This page hopes to highlight the problem of being misled by online maps Ordnance Survey maps. A common source of good online maps is the National Library of Scotland. Their 25 inch series covers most of the UK and is wonderful for extracting small portions for specific geographic and historic content. What it cannot do is date the extracted portion.

The Pembury History website uses a lot of these extracted portions to indicate the presense of long lost features such as houses, blacksmith workshops, mills, farms, oast houses, etc.  Other data should be used to verify dates of these features.

The UK coverage of these Ordnace Survey maps is achieved by stiching together many hundreds of individual maps. They have been sourced from local libraries and private collections and have been scanned or photographed at a standard resolution to give the appearance of one large map.

The England and Wales 25 inch series spans 1841 to 1952 and there is no guarantee that neighbouring sections are from the same era.  The following examples show how neighboroughing sections are from different periods and clearly indicate a change in local development. This should be a warning that you should not trust these maps for dating purposes.


The example above is of Tunbridge Wells and shows the junction of 4 sections.  The top-left quadrant is clearly from a later period showing the development of new roads and housing.


The example above is of Edenbridge and shows the junction of 3 sections.  The right portion is clearly from a later period showing the development of Stangrove Road over a previous field.


This example is of Fulham and shows the junction of 4 sections.  There are no obvious geographical changes but it is clear  that these sections are not from the same issue of maps, not of the same vintage and as such should not be trusted when making comparisons across sections.


Notes on Ordnance Survey (OS) map dating.

Dates on OS maps are often confusing, particularly when taken from a referred text in a book or on a web site.
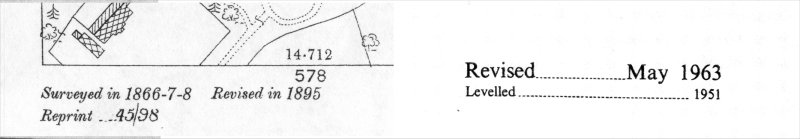
Here is an example of a typical, fictional OS map with all the traps ready to snare a bit of historical research –

1898  Full survey carried out.    1899 drawings prepared for the printers

1900  First edition printed of the “1900 Edition”.

1904  Some minor corrections and alterations added to 1900 Edition with small print note “additions and correction – 2nd impression 1904”

1907  Some minor corrections and alterations added to 1900 Edition with small print note “additions and correction – 3rd impression 1907”

1909  Some minor corrections and alterations added to 1900 Edition with small print note “additions and correction – 4th impression 1909”

1912  Full survey carried out.    1913 drawings prepared for the printers

1914  First edition printed of the “1914 Edition”.

OS maps generally have the main edition date in bold typeface and re-issue dates in small type, sometimes away from the main publication date.    Here is the big problem – a building (or anything) may have been added or subtracted from the map in 1907 or 1909.    A new building, or feature, created in 1901 may not appear in any sub reissues. It may not appear until the 1914 edition after a fresh, full survey.
A researcher finds the map with the added or subtracted feature and looks at the main publication date of 1900 and comes to the wrong conclusion.  For real nitpicking, pedantic accuracy this kind of map should be declared 1898 – 1912  or  1900 – 1914.  This requires even greater research!   Historians should inform their readers that the data on any map should not be tied to the given date of the map. 


Above – a few typical examples of cryptic dates on OS maps.   
“Levelled” means surveyed.   Ancient surveyors were known as levellers.


The old printed copies of Ordnance Survey maps carried some basic dating information about when surveys were conducted and when maps were re-issued.  It is important to understand that reprints and re-issues do not contain fresh data.
The two inscriptions above indicate that originally the surveys were conducted between 1866 - 1868 with a revised survey in 1895. The reprint 45/98 is not clear but suggests the dates of 1945 and 1898. This is most unlikely as there were no re-issues to the public during the war years including 1945.  1845 does not make sense, so this may be an error. It may have been intended as 1895.
The later inscription suggests that the map was revised in May 1963 from an earlier survey in 1951. 

None of this data is available with the online maps, as it was all stripped off when the sections were digitally stitched together.
Each section had its unique set of dates of surveys and issues, and there is now no telling what applies to any section.
Be warned - tread carefully with online maps.


Deliberate OS Errors

  In the mid 20th Centurey The OS started planting deliberate errors in their maps for copyright purposes. These were small, insignificant artifacts, such as farm barns, small outhouses, short tracks and paths that did not exist. The idea was to catch anyone infringing their copyright by illegally copying and publishing parts of their maps. They successfully sued the AA (Automobile Association) for just such an infringement.  Once again, you can never 100% trust a map!


Misleading Boundaries

This section deals with boundaries and how they may, or may not, change on maps. Many old boundaries followed geographic features such as rivers, valleys, ridges and hills.  Some followed well established tracks, paths and fields.  When some of these features changed the boundaries did not. Possession of land far outweighed the diversion of a river or road.


For many miles the boundary between Kent and Sussex follows the River Teise.
The river in this area near Dundale was diverted several times over many centuries.
At one time it was used to aid production of iron production for cannons and weapons.


Today there is a pond, but the boundary still follows its original line across the bottom of the pond.


Below are a few more examples of boundaries following their ancient paths along old courses of the river.


In most cases a boundary is deemed to be at the centre of a river or stream.

In the USA many boundaries do not follow the middle of a river, but the extreme shore of one state or county. The practice originates from the primary state staking a claim on the river in order to control trade and claim taxes and tolls.  Neighbouring states that followed had to conform to the regulations and accept that they had little or no ownership beyond the shore line. This is particularly acute between New York and New Jersey. Where a landowner has built a pier or a jetty out into the river they have found themselves having to pay taxes to the state on the other side of the river.


Never Trust a Map - an article on errors and fanciful additions made to antique maps.


Tony Nicholls   2024

Misleading and Misreading OS maps


IMPORTANT !!!     This needs your help.  All contributions will be credited.  If you have any further information or corrections please contact me –
Tony Nicholls            email:  pemburyhistory@gmail.com